
Chart Improvements on SaxoTraderGO
A number of improvements to the chart in the SaxoTraderGO platform are now available:
New chart type – Percentage Comparative chart
New studies
New display options
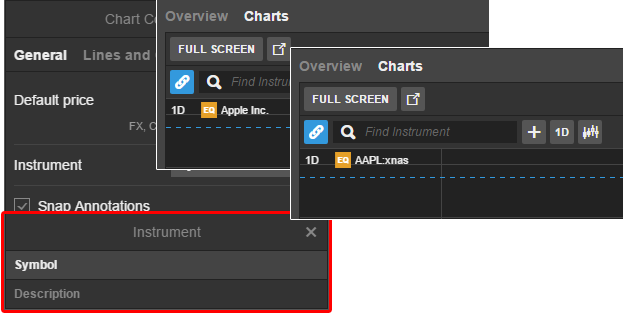
Instrument symbol or description
A new option allows you to display instrument names as a symbol (ticker) or description:
Price label
The last price indicates whether it is an uptick or downtick by red or green background colouring (or a blue) if no price activity for 3 seconds.
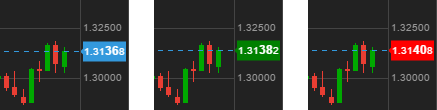
The price for FX charts also emphasizes the pips in alignment with the rest of the platform.
Fill colours for candlesticks and studies
We have added new colour options where you can define the line, border and fill colours for candlestick charts and studies such as Bollinger Banks.
You can also configure hollow candlesticks by selecting no colour.
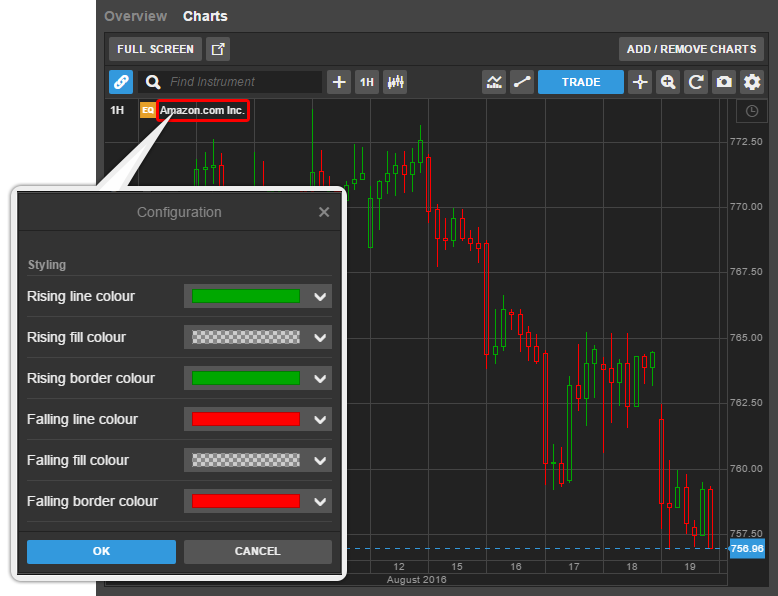
Similarly, for studies such as Bollinger bands you will be able to define or remove the fill colour between the bands.
Fibonacci adjustment to the right
The length of the lines on Fibonacci Annotations can now be adjusted left/right. Select the Fibonacci you want to adjust and grab the handle and drag the lines left or right.
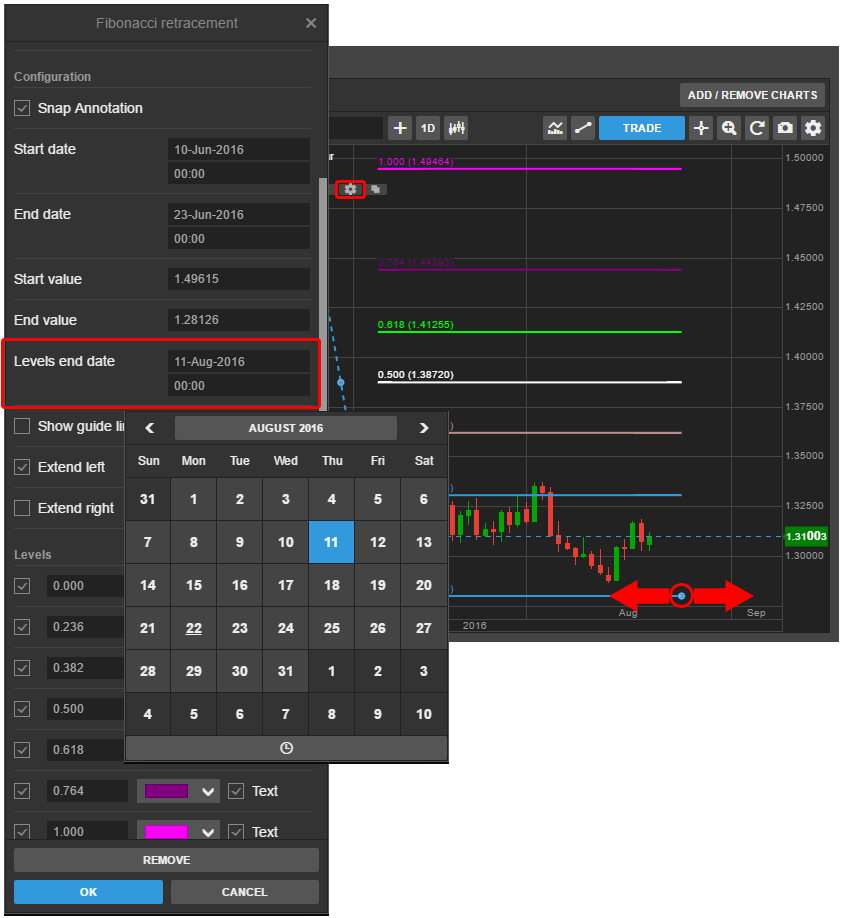
In the Settings for the annotation, you can adjust the end time and date or extend them infinitely.
Vertical line extension
It is now possible to extend vertical line annotations through to sub-panels by clicking on the configuration icon and selecting Extend vertical line.
Copy Annotations
You can now copy annotations by clicking the copy icon on the annotation. ![]()
Individual snapping
Now you can also select or de-select snapping in each individual annotation in the specific annotation configuration settings.